Data-Driven Scheduling Decisions
Track booking trends, peak demand times, team performance, and conversion rates. All from a single dashboard designed for action.
You can't improve what you can't measure
How many meetings did your team handle last month? What's your no-show rate? Which team member has the highest booking volume? Most scheduling tools give you a list of past meetings and call it analytics. That's not insight. It's a spreadsheet.
Analytics built for scheduling professionals
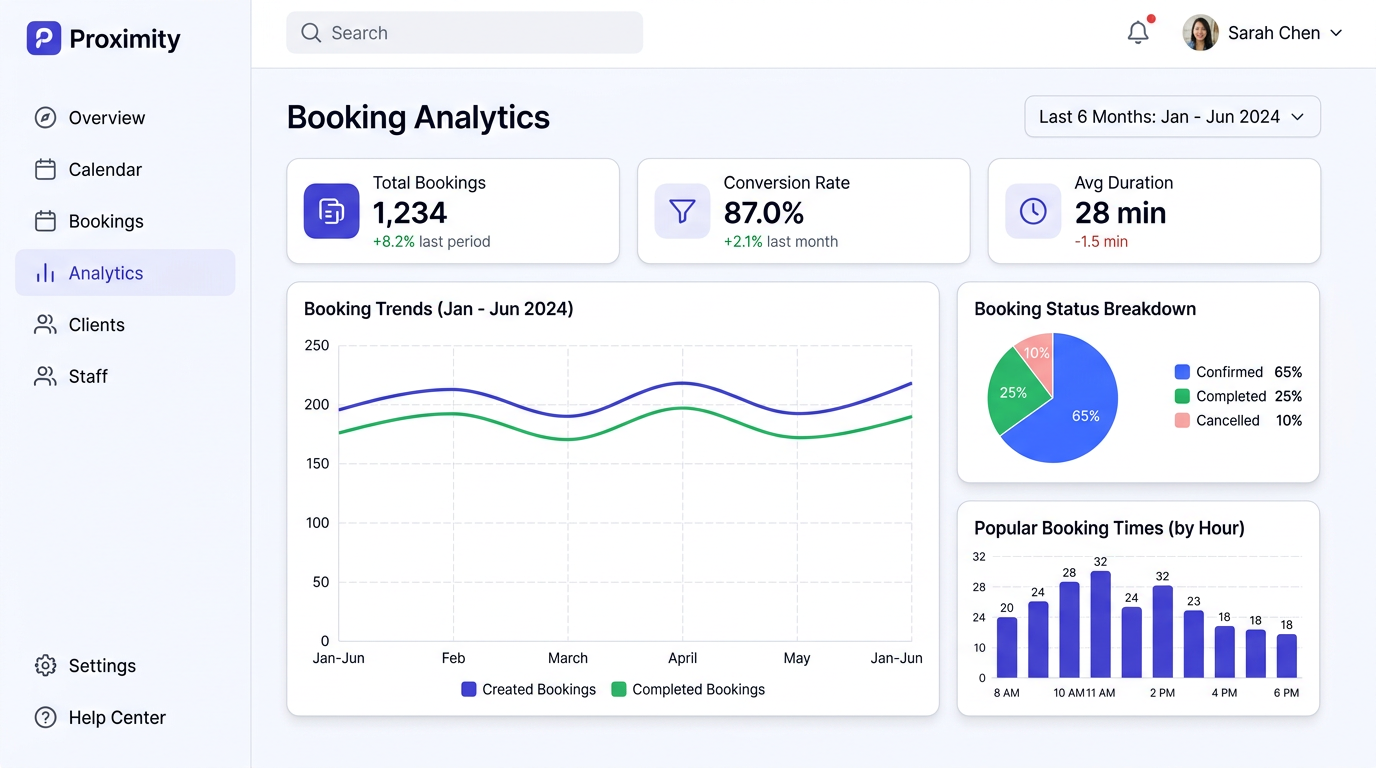
Proximity's dashboard gives you actionable insights at a glance. See booking trends over time, identify your busiest hours and days, track conversion rates from page view to confirmed booking, and compare team member performance.
Key Capabilities
How It Works
Open your dashboard
Your analytics dashboard is the first thing you see when you log in to Proximity.
Explore the data
View booking trends, popular times, and status breakdowns. Filter by date range or event type.
Identify patterns
Spot trends like increasing no-show rates or seasonal demand changes.
Take action
Adjust your availability, add reminders, or redistribute team load based on real data.
Analytics included, not gated
Competitors reserve analytics for enterprise tiers. Proximity includes the full analytics dashboard on every plan, because understanding your scheduling performance shouldn't be a premium feature.
Use Cases
Sales Managers
Track team meeting volume, conversion rates, and identify top performers to replicate their success.
Solo Consultants
Understand your busiest days and times to optimize your availability and pricing.
Operations Teams
Monitor no-show rates and adjust reminder workflows to reduce wasted time.
HR Teams
Track interview scheduling metrics to identify bottlenecks in your hiring pipeline.
Get started with Buchungsanalysen
Keine Kreditkarte erforderlich. Kostenloser Tarif dauerhaft verfügbar.